Demo · Real Satellite Monitoring
Two dams and a rainstorm, watched from orbit.
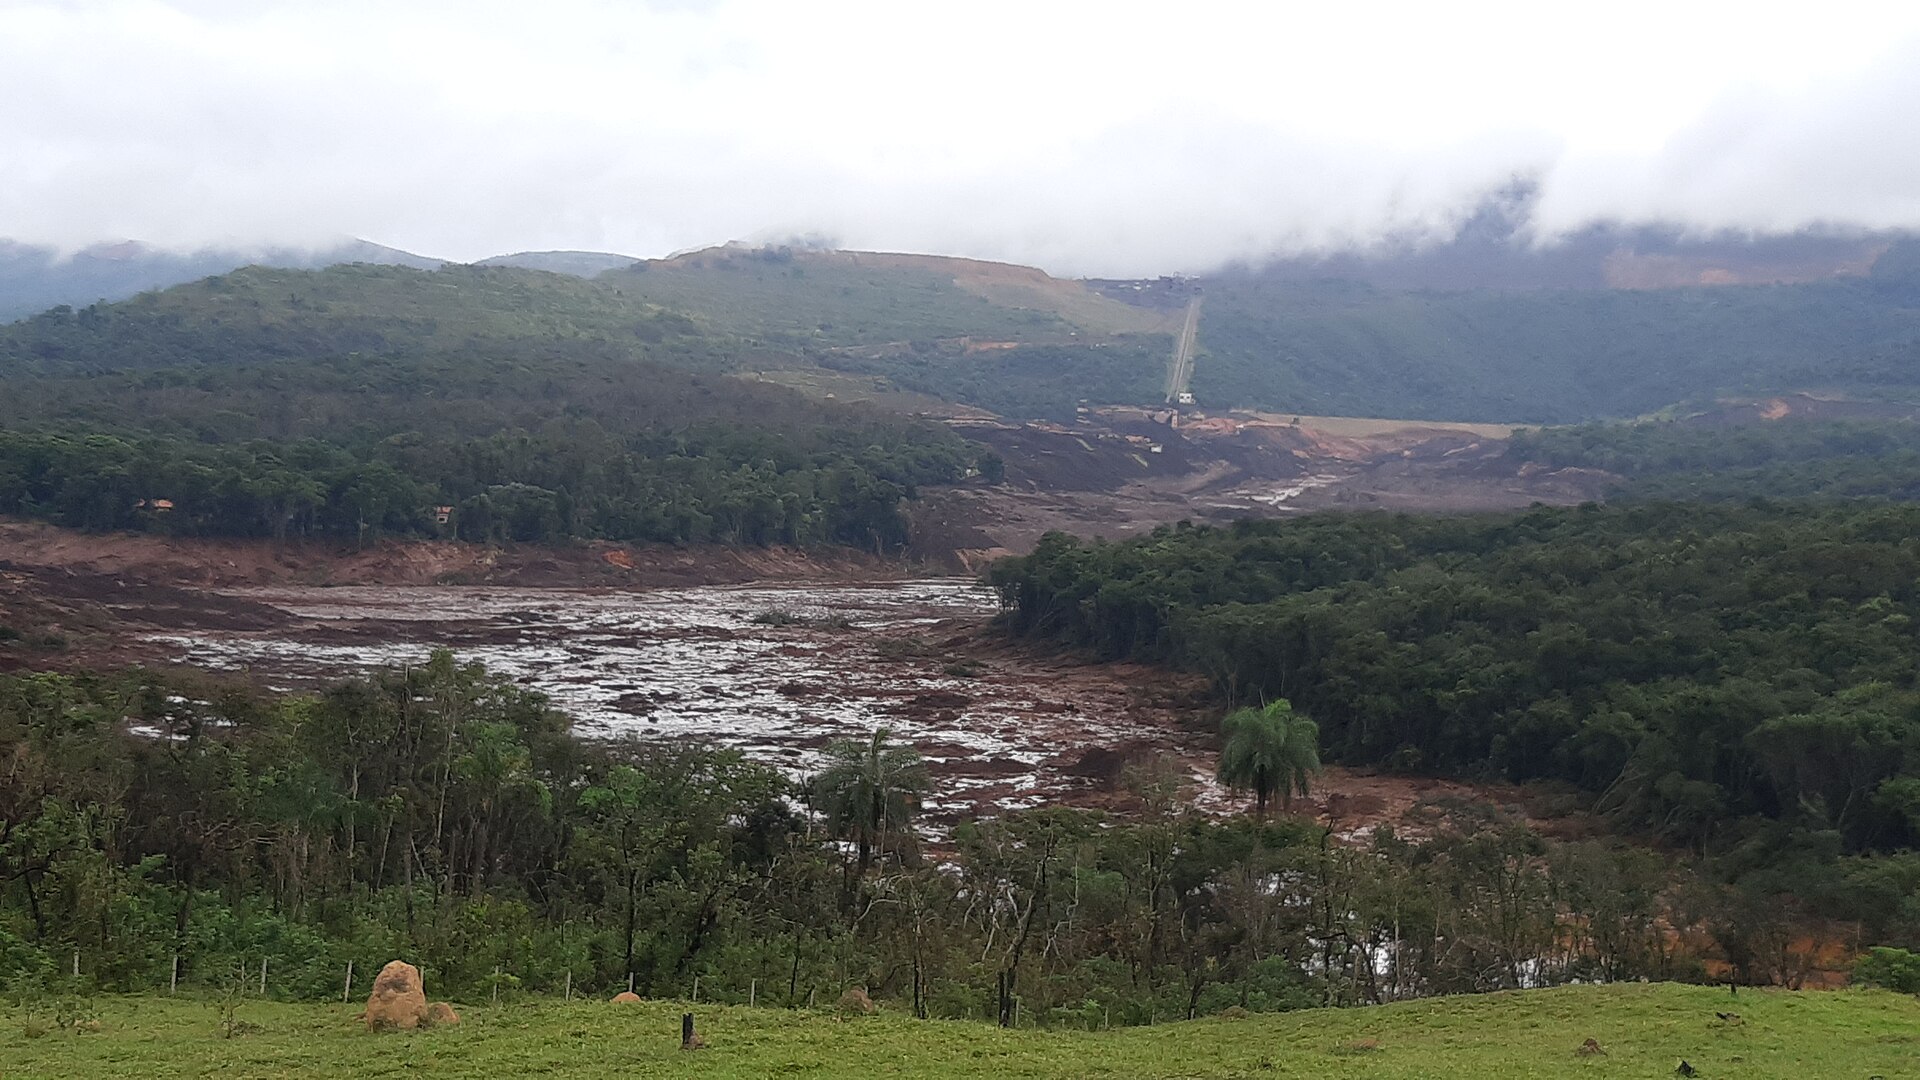
The same pipeline on very different problems. The Córrego do Feijão tailings dam at Brumadinho, whose 2019 collapse killed 270 people, reconstructed from the record to show what the deformation signal looks like before a failure. The Three Gorges Dam, the largest on Earth, monitored live from open satellite data for both ground movement and reservoir water. And the September 2023 Hong Kong black rainstorm, re-run through the same change-detection machinery to ask a blunt question: when the hills fail under cloud, can free radar find the scars?
How this pipeline works, step by step →
← Back to both dams
Live monitor · Three Gorges Dam · measured through the latest pass
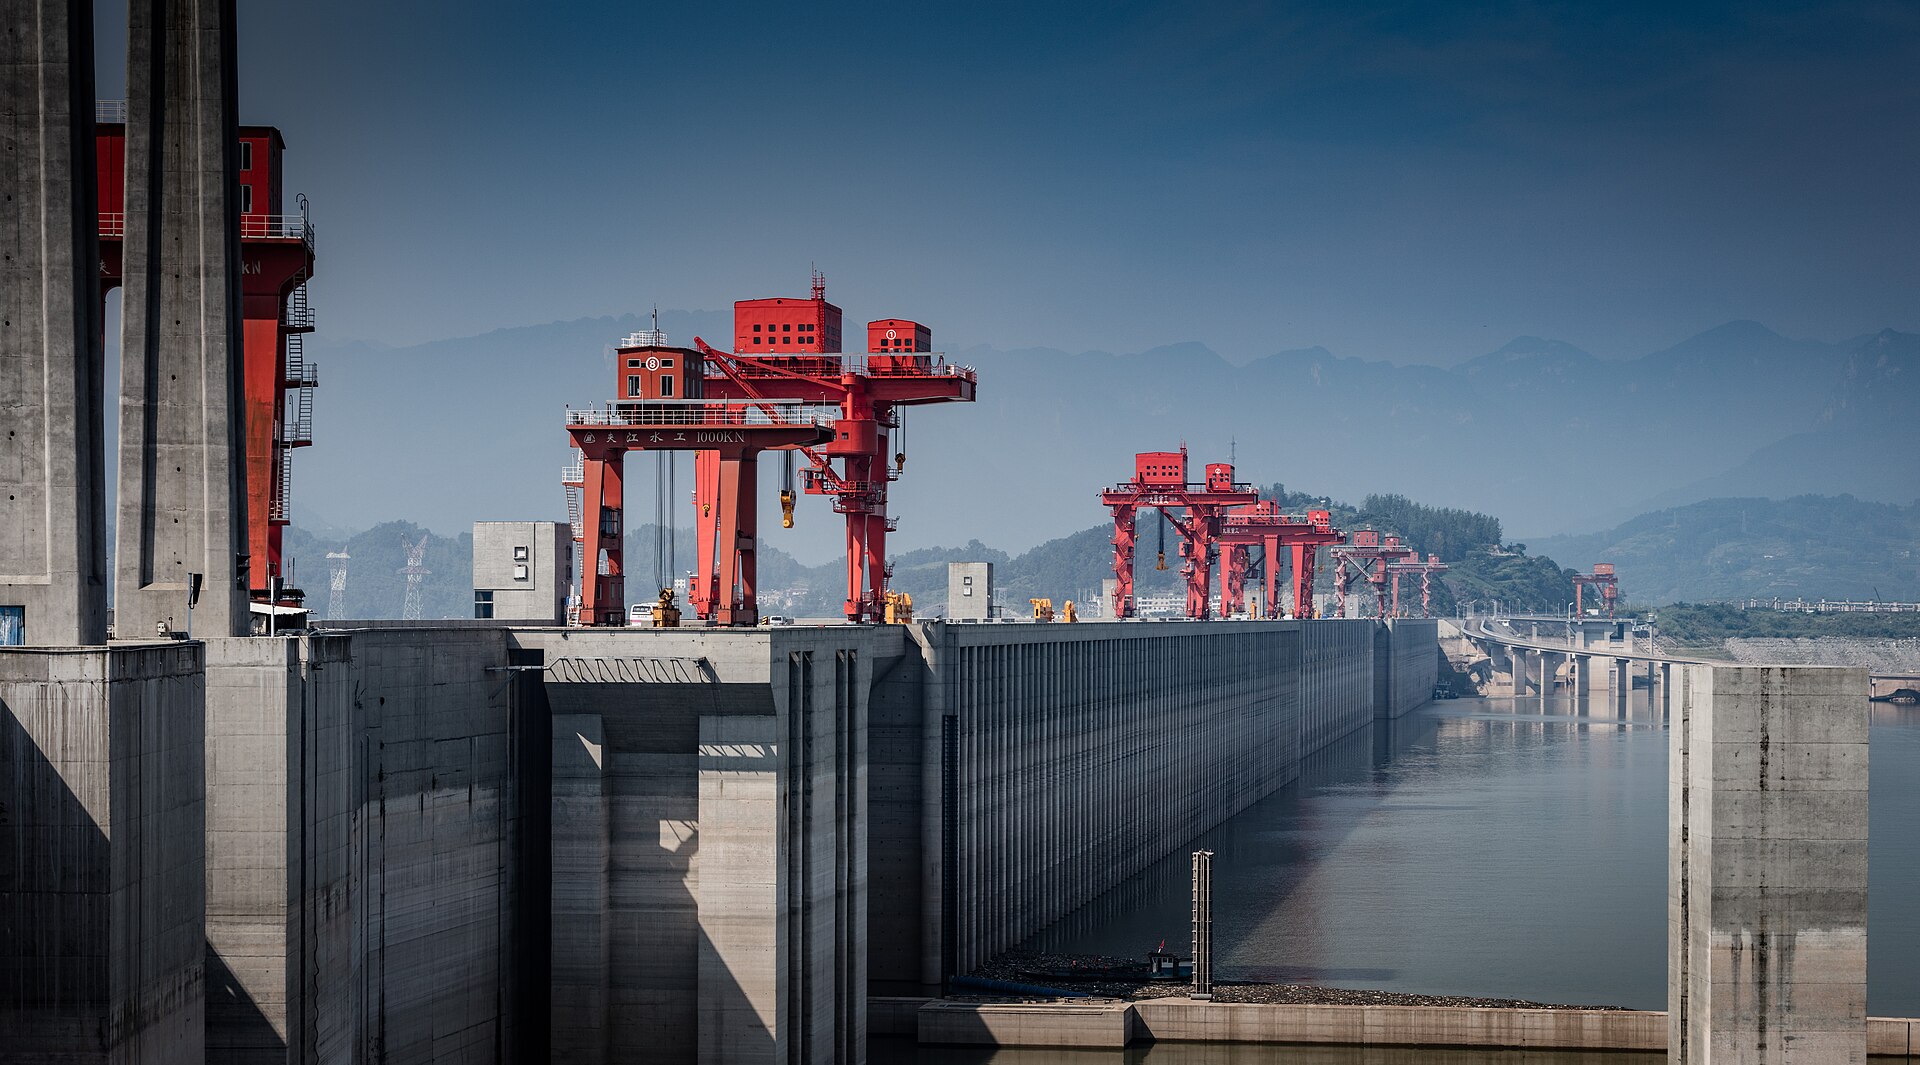
The largest dam on Earth, watched live.
Two real pipelines run over the Three Gorges Dam today: Sentinel-1 radar turned into millimetre
ground movement with InSAR, and Sentinel-2 optical turned into a reservoir water monitor checked against the
season. Every number below is measured from open satellite data on the dates shown; none of it is a mock-up.
How this pipeline works, step by step →
Is the dam actually moving?
There are persistent rumours that the Three Gorges Dam is deforming or about to fail. So we measured it: three years of Sentinel-1 radar, turned into millimetre ground movement with InSAR. This is the deformation parameter, the signal that actually precedes a dam failure.
Line-of-sight ground displacement, per radar pass
Measured displacement
Linear trend (velocity)
Noise band (±1σ)
And the reservoir it holds
The second parameter, on the same open-data pipeline: the water surface itself, from Sentinel-2 optical, checked against its seasonal cycle.
Reservoir water surface, per cloud-free pass
Measured water area
Expected seasonal baseline
Normal range (±3σ)
Flagged anomaly
Real data in
Sentinel-2 L2A scenes over tile 49RDQ, read straight from Copernicus COGs on AWS Open Data. No credentials, no download step: the pipeline reads only the pixels over the reservoir, on demand.
Indexed & cleaned
Each pass is masked for cloud and shadow with the scene classification band, then scored for open water with the NDWI index. Passes with too little clear sky over the reservoir are dropped, not guessed.
Anomalies flagged
A seasonal baseline is fitted to the water-area history, and each pass is scored by how far it sits from what the season predicts. Anything past three standard deviations, computed to resist outliers, is flagged for a human to look at.
See the other demo: Brumadinho tailings dam, the collapse read from orbit →
← Back to the demos
Case study · Hong Kong · 7–8 September 2023
Could a satellite have found the landslides?
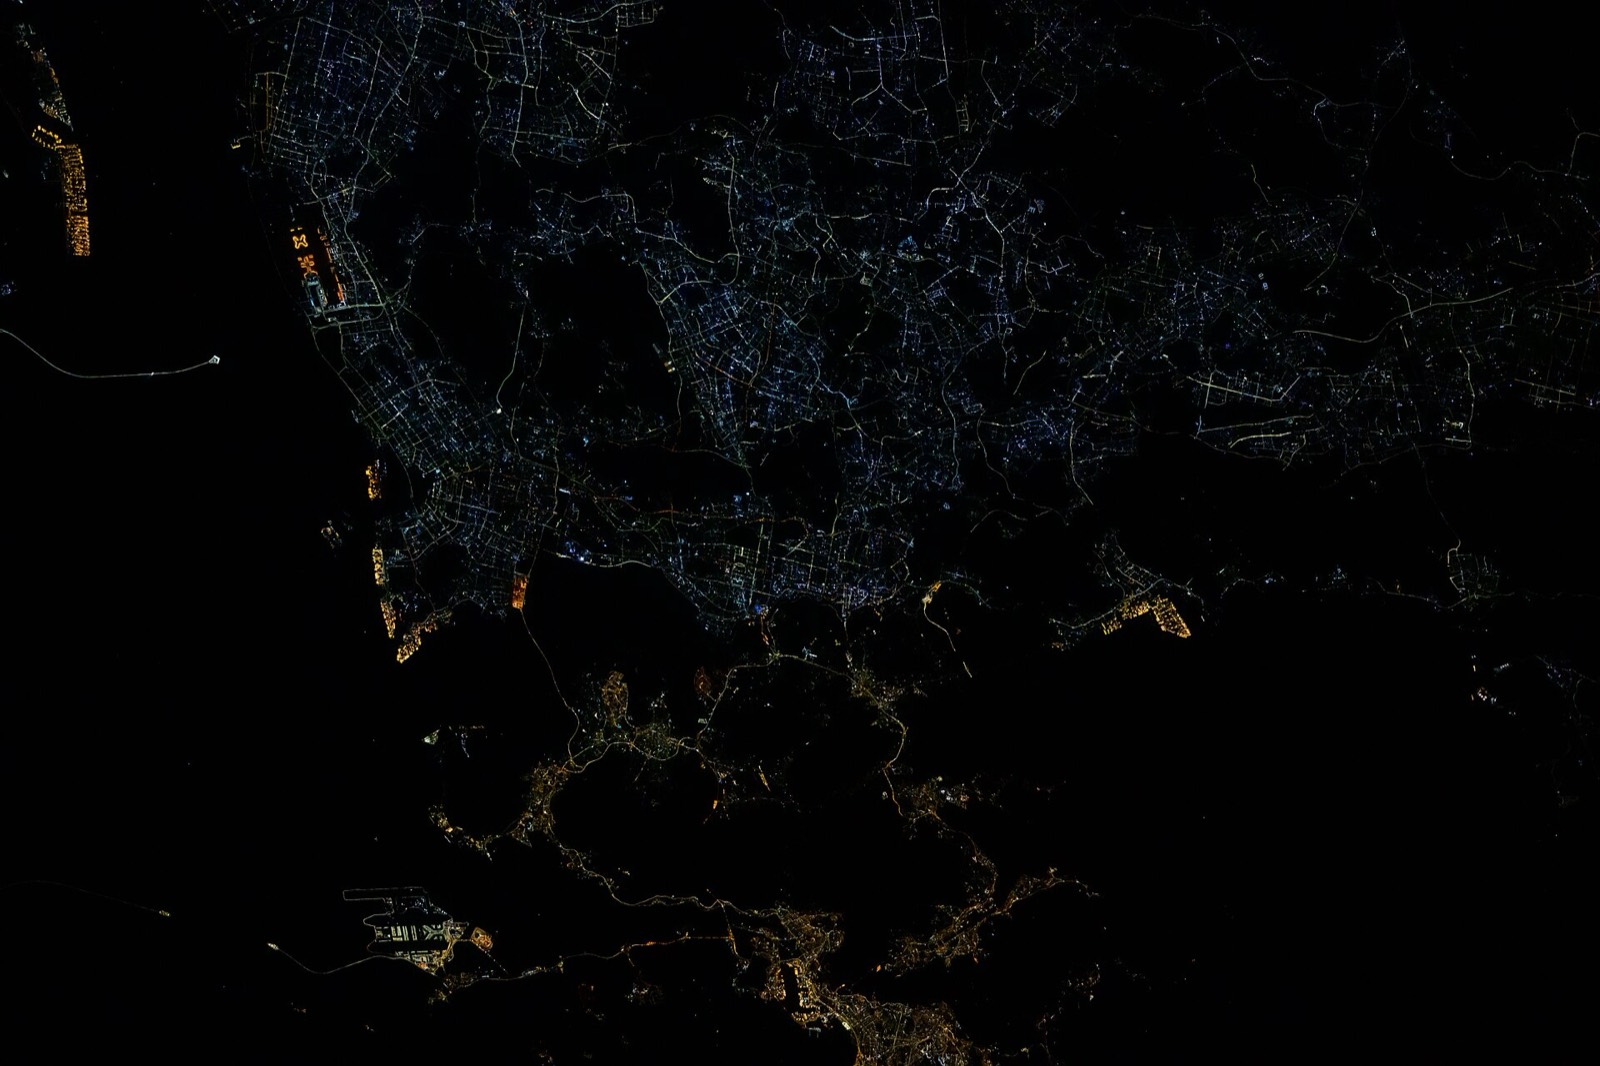
On the night of 7 September 2023, Hong Kong recorded 158.1 mm of rain in a single hour, the most in any hour since records began in 1884. By morning the hillside behind Shiu Fai Terrace had come down, a slope above Yiu Hing Road in Shau Kei Wan had failed, and a stretch of Shek O Road had collapsed. The cloud that brought the rain also blinded every optical satellite and grounded the survey flights. Radar sees through rain. So we re-ran the storm through our change-detection pipeline on free Sentinel-1 radar and asked one blunt question: would it have found those failures?
18:25first radar pass, 8 Sept, through active rain
10 scenesJuly to October 2023, two orbits
3reported failures checked against the result
0 of 3cleanly detected at 10 m resolution
The honest answer is no. Measured properly, that answer is worth more to a slope owner than a sales pitch.
The scar signal against the noise
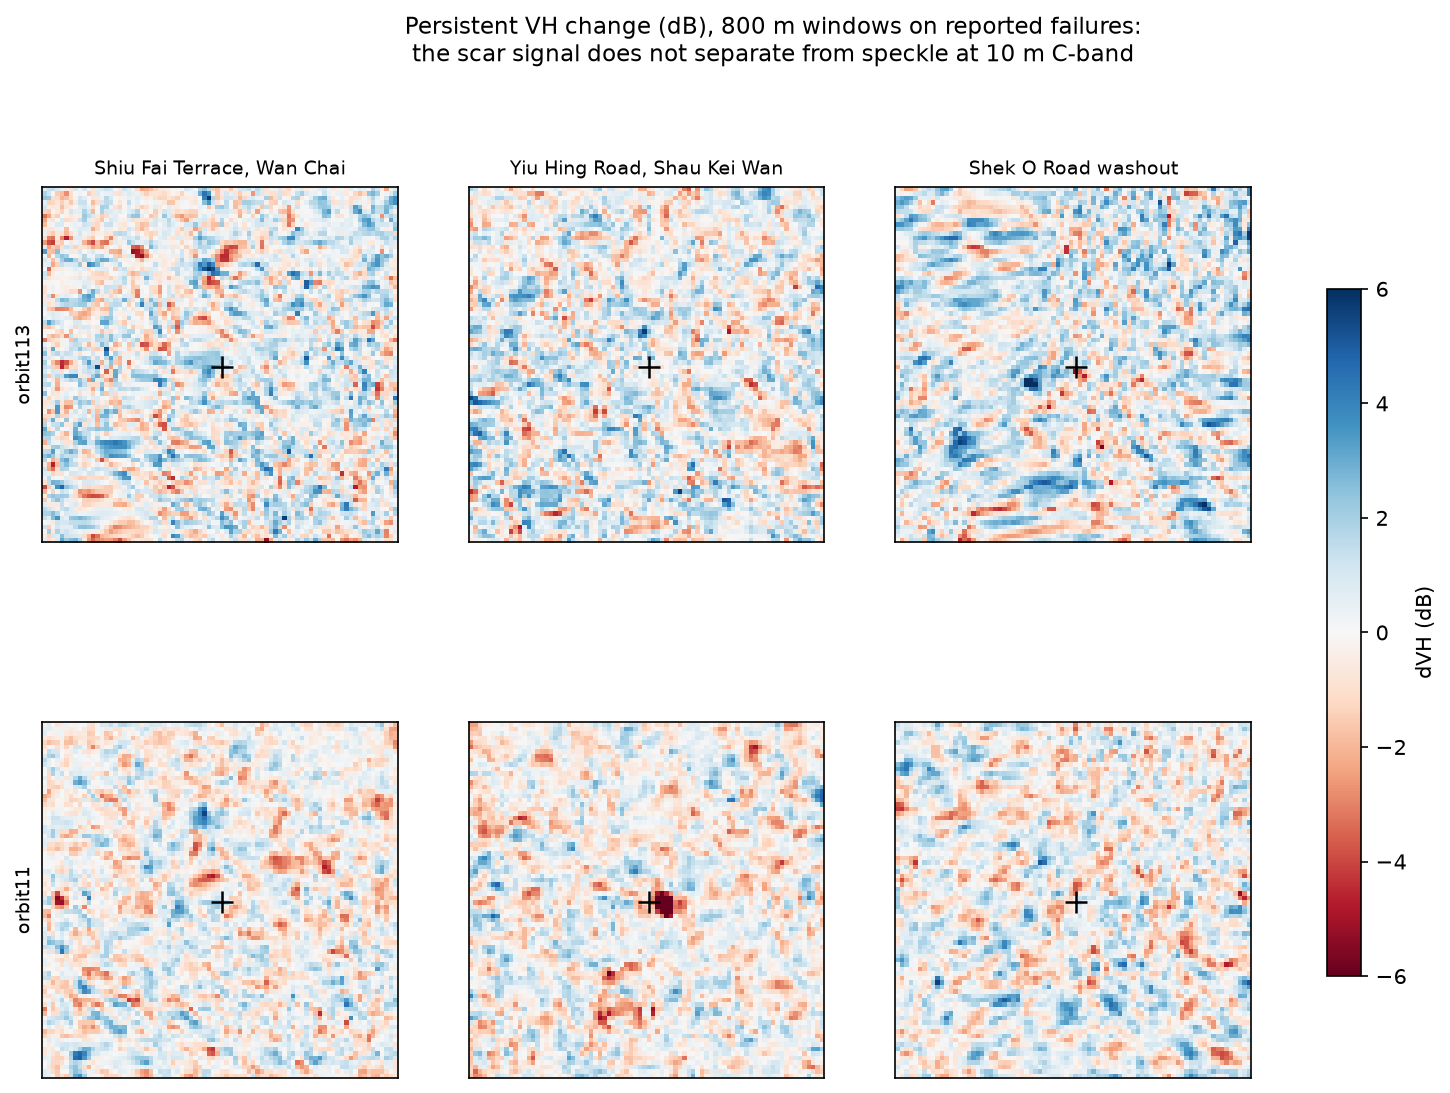
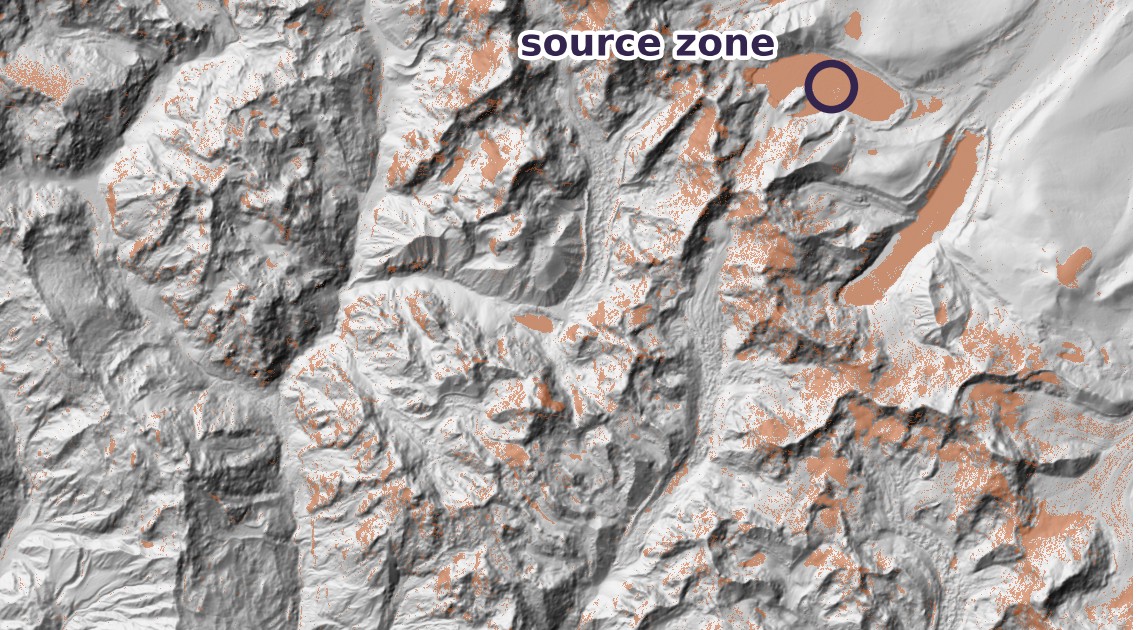
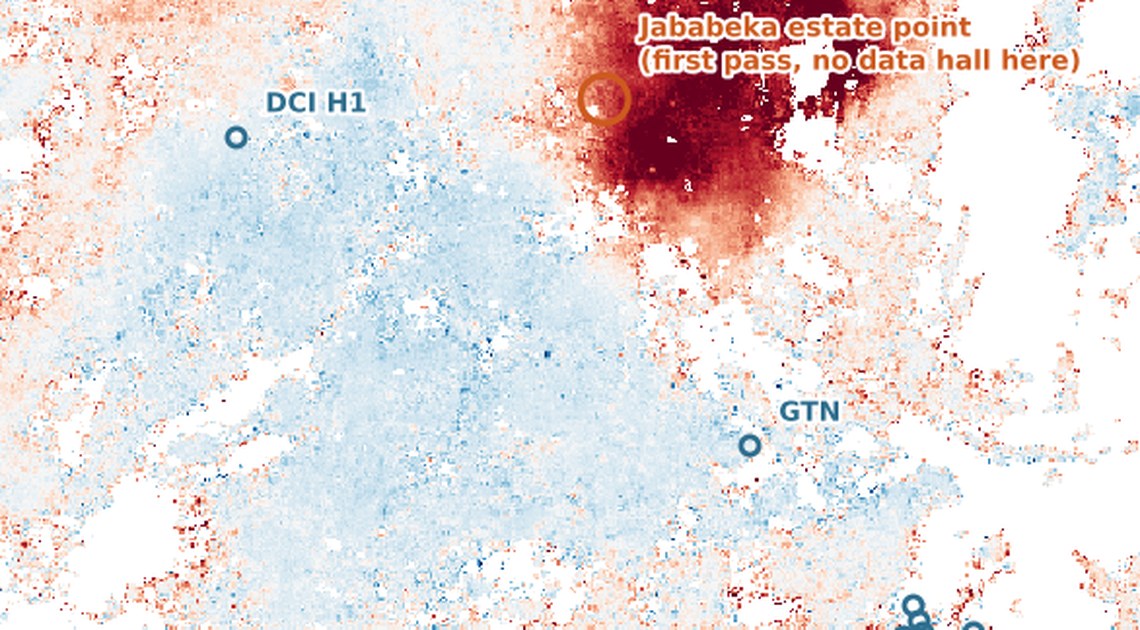
Persistent radar change over the month after the storm, in 800 m windows centred on the three reported failures (crosshairs), from both satellite orbits. Red is vegetation lost. The Yiu Hing Road scar is genuinely there in one orbit: the dark spot on the crosshair, two pixels wide. Nothing else separates from the speckle.
What we did
Sentinel-1 imaged Hong Kong at 18:25 on 8 September, about nineteen hours after the black rainstorm signal went up, while the rain was still falling. That same-day pass is the part optical satellites cannot offer: they returned nothing usable for days. We took four quiet scenes from before the storm as a baseline for each orbit, differenced every later pass against it, and kept only the changes that persisted across a month of passes on slopes steeper than 15 degrees. A real scar strips the vegetation and stays bare; noise comes and goes. This is the standard method, done carefully, on the best free radar data there is.
Then we checked the result against the three failures everyone in Hong Kong read about.
What we found
These landslides were serious: buildings evacuated, a road severed. But each scar covers a few hundred square metres, a handful of pixels at 10 m resolution, and radar speckle on steep vegetated ground swings several decibels between passes. Shiu Fai Terrace does produce a candidate 59 m from the mapped failure, but it ranks 1,722nd of 2,341 candidates territory-wide: real, and useless, because no duty officer can walk two thousand sites after a storm. The other two never rise above the noise at any threshold. This matches the published detection limit for Sentinel-1 amplitude change, roughly one hectare, an order of magnitude larger than a typical Hong Kong failure.
Territory-wide candidates, ranked and unvalidated
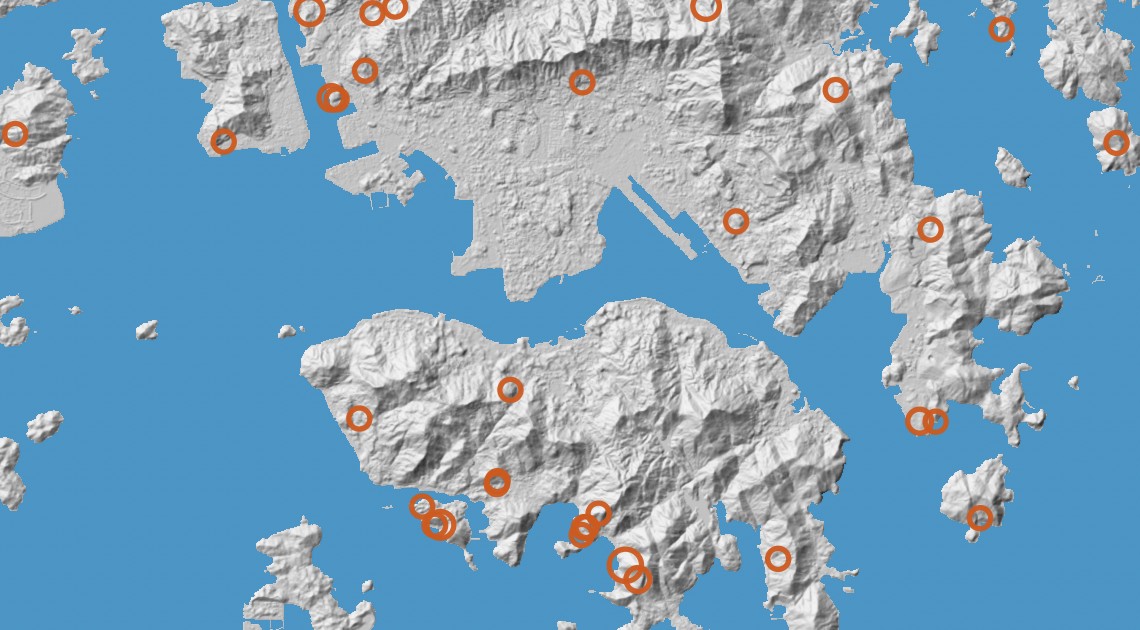
The 100 strongest persistent-change clusters after the storm, sized by area; grey circles fall across the boundary in Shenzhen. Some of these are real failures, and many are construction, clearance or residual noise. At this resolution the map is a triage list, and it has to carry the label: unvalidated.
Why publish a negative result?
Because "why not use the free satellites?" is the first question every slope owner asks, and it deserves a measured answer rather than a confident one. We ran the free route to its limit so that you do not have to: every scene ID, threshold and number in this study is checkable against the open archive.
The physics is fine; the resolution is the constraint. A tasked commercial radar satellite images at around one metre in the same all-weather way, so the scar that gives Sentinel-1 eight ambiguous pixels gives it eight hundred clear ones. The operational design then writes itself from the rainfall: the observatory's warning triggers the tasking, the satellite images through the storm, and the scar map is on a desk while the cloud is still overhead. Days of not knowing become hours.
Contains modified Copernicus Sentinel data 2023, processed via Microsoft Planetary Computer. Terrain: Copernicus DEM GLO-30. Full numbers: the run's JSON.
Slopes above a road, a railway, a reservoir?
When the next black rainstorm lifts, know that evening.
The trigger comes from the rainfall, the tasking follows automatically, and the answer arrives while the response is still running. Tell us the portfolio and we will scope the design.